Add annotations to the Performance graph to record events, view performance, and gain insights into performance shifts.
Path: MPC Dashboard > FAQ/Voice > Performance
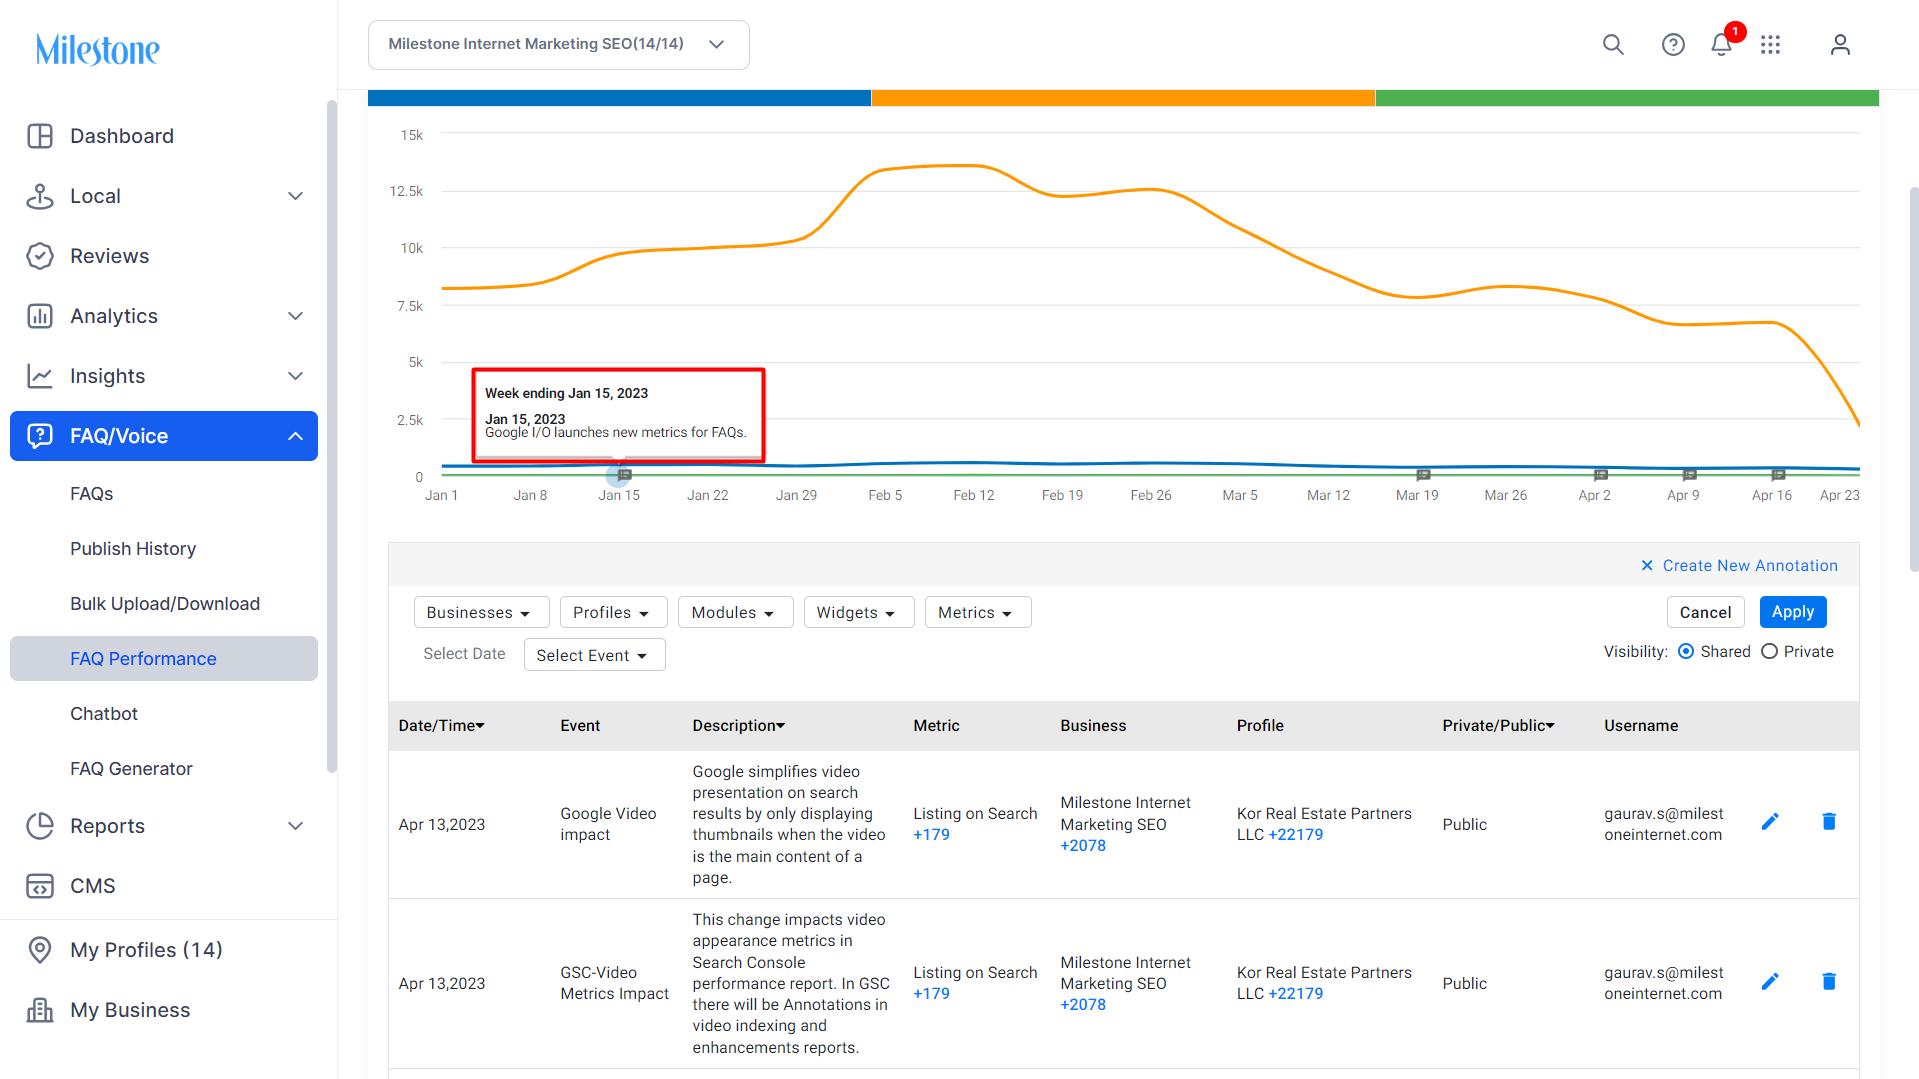
Step 1: In the ‘FAQ/Voice’ section go to ‘FAQ Performance’ on the left navigation panel.

Step 2: Click on the Annotations dropdown below the graph.

Step 3: Click on ‘Create New Annotation’.

Step 4: Use the dropdown menu to provide the required information. You can also select pre-existing events to describe the annotation.

Step 5: If you want to create a new event, click on ‘Add Event’ from the Event dropdown menu.

Step 6: Fill in the Event Name and Description in the ‘Add New Annotation’ section and click on ‘Save’ to update the annotation

Step 7: Select the ‘Add to predefined list’ if the event occurs periodically. It will be added to the Event dropdown menu.

Step 8: Click on 'Save'.

Step 9: Click on 'Apply' to add the annotation to the widget.

Added annotation.
Was this article helpful?
That’s Great!
Thank you for your feedback
Sorry! We couldn't be helpful
Thank you for your feedback
Feedback sent
We appreciate your effort and will try to fix the article